Ad spend tracking online is complicated! You’ve got to manage tracking pixels and conversion events and custom javascript across all your different platforms. Then, you have to log in and find everything!
But what if there was a way to monitor ad spend automatically, tracking everything you want to know about your ads—conversions, clicks, reach, and even whether your ads are really making money—all in one place?
In this guide, you’ll learn exactly how you can create an ad spend tracking automation yourself, and make sure your actual spending is getting the results you want for your digital ad budget.
![]()
Why Create an Ad Spend Tracking Automation?
I’ve always been nervous to go all-in on Facebook ads because it’s so hard to track whether they really help.
I’ve been doing digital marketing since 2011, back when social media platforms were first building their advertising programs. I have friends who scaled their businesses with ads, creating $100,000+ a month ad funnels, racking up the airline points, and building their digital media empires.
But while I’ve dabbled in ads, spending low six-figures on Facebook and Google ads, I’ve always wondered, do you they really work? Are we making money on these? Are we really accomplishing our goals?
The problem is that since Google’s HCU update in Fall 2023, search traffic is a much less reliable way to growth, and I know I need to get more traffic from other sources.
And so, when I stumbled on this idea for an automation, and even better, when it started working, I was thrilled to be getting real data on what was working (and not working) with my ads.
Since then, I’ve doubled my ad spend, increased sales and traffic, and had a much clearer picture on how to use ads effectively.
Now, I want to help you have more clarity around the effectiveness of your ads too!
How This Ad Spend Monitor Automation Works
While most agencies hire a developer to install conversion tracking events from Facebook Business Monitor, Google Ads, LinkedIn ads, or other digital advertising platforms, and then use those same platforms to track what’s happening in your ads. Or else use manual tracking, copy/pasting or exporting data constantly into your dashboard.
There are lots of problems with that approach though:
- You’re at the mercy of expensive developers
- You’re feeding more and more data into huge platforms rather than one central budget tracking tool
- You have to keep track of many separate advertising dashboards rather than having one central place to track all of your advertising campaigns
- It’s not always clear whether you’re getting a fruitful return on your budget
Instead, we’re going to create an advertising spend tracker to track our current spend and determine whether we should increase or decrease our future budget to best grow our business.
We’re going to use Make.com, Zapier, and Airtable to grab information from all your different places and deliver it into one central Airtable, allowing you to have a much clearer picture of what’s happening with your ads all in one place.
I especially like that I’m not just feeding more and more information to big platforms, but instead storing that information for myself.

The screenshot above shows the main dashboard where we track:
- Total Ad Spend
- Total Revenue
- Surplus/Deficit
- Revenue of Ad Spend (ROAS)
- Clicks
- Conversions
- Action Suggestion (where a formula makes a suggestion about whether to increase or decrease the spend!)
Useful, right?! You can see how this could help you get a sense of your campaign performance and fine tune your funnel.
What You Need to Monitor Ad Spend Automatically
To create this automation, you’ll need the following tools:
- Airtable to create the ads dashboard template (Google Sheets won’t cut it for this automation, but the free version of Airtable should be fine).
- Make.com. This is an automation tool very similar to Zapier, but a little more friendly for very technical automations like custom API calls and such. For this automation, it plays a little nicer with Facebook Ad Campaign Manager, which Zapier doesn’t support. I’m not doing much with Make.com right now, though, so I just use the free plan which has more than enough operations for our purposes.
- Zapier to do the rest of the heavy lifting (you can do everything in make.com if you prefer, but since I have most of my automations in Zapier, I like to keep them there).
- Facebook Ad Account. You can also use this with Google Ads and other platforms, but our focus is going to be on Facebook ads today.
- An Existing Ad Funnel. Ideally, you already have an existing ad funnel to keep track of. While we don’t have time here to go over the marketing strategy behind your funnel, for us, here’s how ours works:
- We use Facebook Ads to send traffic to this landing page promoting an assessment that helps people better understand their book idea.There’s a free version of the assessment and a $17 version, but everyone gets added to our email list after taking the assessment.
- Once they’ve taken the assessment, they get an email with their results and have another opportunity to upgrade.
- Then, they get a 5-email welcome sequence which includes some of our best content and then an opportunity to purchase a course related to the assessment that’s normally $149 but is on sale to new subscribers for $59.
That’s it! So once you’ve got your ad funnel, it’s time to get tracking. Next, let’s take a look at the actual templates.
Ad Spend Tracking Templates
We’ll give you a step-by-step rundown on how to build and customize this automation for your use below, but you can get a head start with our free ad spend tracking templates:
- Airtable Ads Dashboard Template
- Make.com Facebook Ad Campaign Monitoring Automation Template (I’m not able to create a template with my free plan currently, but I’ll explain how to set this up below)
- Zapier Ad Funnel Tracking Automation: Shopping Cart to Airtable
- Zapier Ad Funnel Tracking Automation: Typeform to Airtable
Take a quick look at each of the templates above, make a copy, and then let’s dive in to the steps and logic behind creating this automation.
The Steps to Building this Ad Spend Tracking Automation
To build this automation, we need to start with creating our Airtable base to store all of our incoming data. The base will have three different tables:
- An Ad Spend Table where we’ll bring in the daily ad spend and the results from the ads.
- A Revenue Table where we’ll track sales.
- An Analysis Table to compare the two sets of data.
When I was building this, I tried to get it down to two tables instead of three for simplicity, but since the data is coming in at different cadences, we needed to separate it.
Once you have your tables, we’ll set up the Make.com and Zapier automations to fill the tables with our data.
Finally, we’ll need three Airtable automations to bring everything together.
Let’s launch into the steps.
Step 1: Build Your Tables
First, we need to build our tables. As I said, you’ll need three tables. I’ll include the fields you need, the field type (since Airtable requires each field be set up as a specific field type), and a brief description of each field.
Build the Daily Ad Spend Table
This is where we’ll store information about our daily ad spend. Here are the fields you’ll need:
- Name (Formula field): The unique title for each entry. I’m using the formula, {Campaign} & ‘ ‘ & {Date}, to display the campaign name and date, but this is up to you.
- Week (Formula field): This is an important field! We’re going to use it along with corresponding fields in each table to match everything together. Here’s the formula—“Week ” & WEEKNUM({Date},’Monday’) & ” (” & YEAR({Date}) & “)”—which will set an output with the week # and year, e.g. Week 15 (2024).
- Date (Date field): The specific date on which the data was added or the event occurred. Our automations will set these.
- Campaign (Single line text): The name of the ad campaign being tracked in case you want to keep track of multiple campaigns.
- Total Spend (Currency field): The total amount of money spent on the ad campaign that day.
- Clicks (Number field): The total number of clicks received by the ad that day.
- Conversions (Number field): The number of conversions, such as sign-ups for your funnel, generated by the ad. Great if you have access to conversions in your ad account, but if not, you can pull this from somewhere else. For me, I’m pulling it from the Typeform assessment. Alternatively, you might pull this from your email marketing tool or CRM.
- Impressions (Number field): The total number of times the ad was displayed to users.
- Cost per Conversion (Formula field): The average cost spent for each conversion. We’re calculating this with a formula—{Conversions}/{Total Spend}.
- Frequency (Number field): The average number of times each user saw the ad. This tracks how many times the average person sees the campaign in their feed. Usually, the higher the number, the less likely your ad will convert, so I like to keep my eye on it.
- CTR (Percent field): Click-through rate tracks the percentage of impressions that resulted in a click.
- CPC (Currency field): Cost per click shows the average cost for each click on the ad. The lower the better!
- CPM (Currency field): Cost per thousand impressions is the cost for every thousand times the ad is displayed.
- Conversion Rate (Percent field): The rate at which clicks on the ad result in conversions.
- Notes (Long text field): Any additional information or notes relevant to the ad campaign or data entry. It’s almost always a good idea to have a notes column just in case.
- Last Modified (Date or Last modified field): The most recent date and time when the entry was modified. This is important so we can use this row as a trigger in a Zap.
- Linked Week (Link to another record field): This will link this table to the Analysis table we build at the end.
- Total Revenue (from Linked Week) (Lookup field): This is a lookup table that shows the total revenue for that week.
- ROAS (from Linked Week) (Lookup field): Return on ad spend, derived from the linked week’s data, showing the return on investment for the ad spend. We’ll pull this from the Analysis table too.
Make sure to Group the results by “Week: Z -> A.” You can also sort by the “Date” field, “Latest -> Earliest.”

Build the Funnel Product Sales Table
Next is where we’ll store all the product sales, as they occur. Here are the fields we’ll need:
- Name (Text field): You could use the order # or customer name who made the purchase.
- Week (Formula field): This is our organizing field that will match everything together. Here’s the formula—“Week ” & WEEKNUM({Date},’Monday’) & ” (” & YEAR({Date}) & “)”—which will set an output with the week # and year, e.g. Week 15 (2024).
- Date (Date field): The exact date on which the transaction or event occurred. As before, our automation will set this, and then we’ll use it in the Week formula field.
- Product (Text field): The name of the product that was sold. Remember we’re only tracking products that are part of the funnel. All of this info will be filled by our automation.
- Revenue (Currency field): The amount of money generated from the sale.
- Source (Text field): The origin or platform from which the product was sold or the ad was placed, if applicable (we track UTM source, but it doesn’t always do a good job of populating).
- Notes (Text field): Any additional information or notes relevant to the ad campaign or data entry. I rarely use this, but worth having just in case.
- Linked Week (Link to another record field): As in the Ad Spend table, this field will link this table to the Analysis table we build at the end.
- Total Spend (Currency field from Linked Week)(Look up field): The total amount of money spent on ads for the referenced week, pulled from the Analysis table.
- ROAS (from Linked Week) (Lookup field): Return on ad spend, derived from the linked week’s data, showing the return on investment for the ad spend. Again, we’ll pull this from the Analysis table.
As in the previous table, group the results by “Week: Z -> A” and sort by the “Date” field, “Latest -> Earliest.”
Build the Weekly Ad Spend Analysis Dashboard Table:
Last, we’ll build the analysis dashboard layout where we bring everything together and start to figure out how well our advertising budget is performing. Here are the fields:
- Week (Formula field): This is our organizing field that will match everything together. We’re using pretty much the same formula as before—“Week ” & WEEKNUM({Week Starting},’Monday’) & ” (” & YEAR({Week Starting}) & “)”—except the label is slightly different.
- Week Starting (Date field): The date when the week begins. We’ll set this up through an Airtable automation.
- Total Spend (Rollup field): The sum of the spending values, pulled from linked records in the Ad Spend Plot Type Assessment. This field aggregates ad spend data across different campaigns for the week.
- Total Revenue (Rollup field): The sum of revenue values, pulled from linked records in the Funnel Product Sales. It rolls up the total revenue from sales associated with the ad campaigns for the week.
- Surplus/Deficit (Formula field): A simple formula to check how much we made/lost on the ad spend—{Total Revenue}-{Total Spend}.
- ROAS (Formula field): Return on Ad Spend, which shows the ratio on how much is generated for each dollar spent on ads—{Total Revenue}/{Total Spend}.
- Clicks (Rollup field): The sum of clicks from linked records in the Ad Spend Plot Type Assessment, showing the total number of times ads were clicked in the week. Rollup fields basically take all of the values for the fields linked to this row and adds them together.
- Conversions (Rollup field): The sum of conversions from linked records in the Ad Spend Plot Type Assessment. For us, this tracks how many people joined the funnel by filling out the assessment.
- Action (Formula field): Maybe the most important part of the automation! Here I’m using a formula to roughly determine whether we should increase ad spend, reduce ad spend, or take no action based on the Surplus/Deficit. Here’s the formula I’m using—IF({Surplus/Deficit} > 99,”Increase Ad Spend”, IF({Surplus/Deficit} < -50,”Reduce Ad Spend”,”No action”)). The way this works is that if the surplus is more than $100, then we should increase ad spend. If it’s lost more than $50, though, then we should decrease ad spend. You can set this to the values that make sense for your goals.
- Action Taken (Checkbox field): A true/false field based on whether I increased or decreased the spend.
- Date Taken (Date field): The date on which the recommended action was taken, if applicable.
- Ad Spend Plot Type (Link to Ad Spend table): This will link the daily ad spend records to this analysis table. You’ll probably already have this by now.
- Sales of Intro Products (Link to Product Sales table): This will link the product sales table to this analysis table. You’ll probably already have this too.
While we’re here, sort this table by “Week Starting” and “Latest -> Earliest.”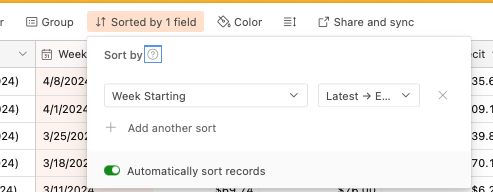
Alright, now that we have all of our tables, it’s time to start filling them up!
Step 2: Create the Ad Spend Automation with Make.com
Zapier is amazing at so many things, but unfortunately it doesn’t play nicely with Facebook Ads Manager (as of right now!). While I still prefer Zapier for most things, Make.com is a great automation builder in its own right and is especially good at automations that require a little more coding or direct API calls. For our purposes, they have an integration with Facebook Ads Manager that Zapier doesn’t! (So if you don’t have a Make.com account, make sure to go create one here. It’s free up to 1,000 operations).
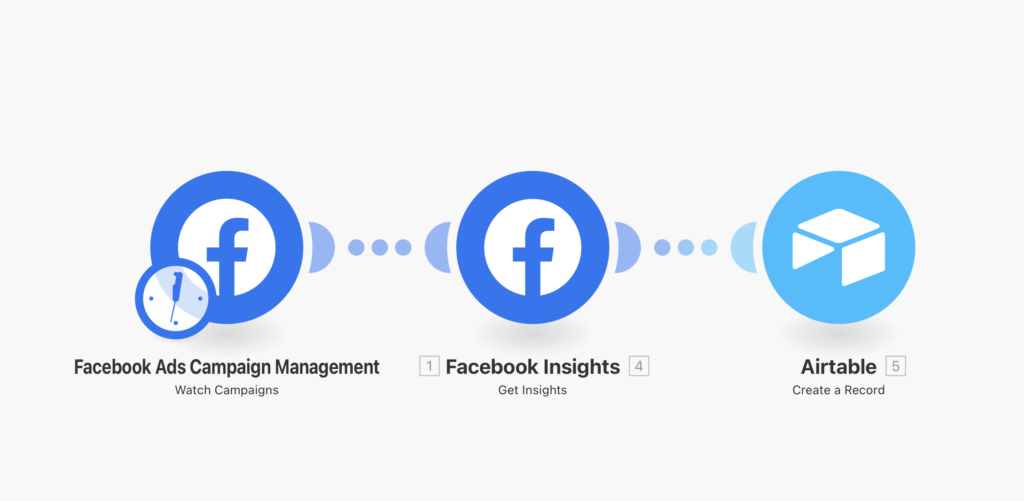
Here’s a screenshot of how our automation will look:
- Start by signing up for Make.com here, if you haven’t already.
- Next, create a new Scenario.
- Then, set up your first step: Facebook Ads Campaign Management – Watch Campaigns. This allows you to start getting info from Facebook Ad campaign.
- Edit your trigger by clicking the clock. It should automatically be set to trigger based on a schedule, but we want to change the interval to once per day. Choose the time that best fits your schedule (like when you’d want a notification about the results). I chose 9:00 am.
- Add the next step, Facebook Insights – Get Insights. This allows us to get all of our performance metrics from the ad campaign. Things like impressions, clicks, CTR, CPC, and more.
- Finally, let’s send all the data to an Airtable through a Create a Record step. You’ll send it to your Ads Tracking table, and don’t forget to match all the data from your ad campaign to the right fields!
- Once your automation is created, go ahead and test it to make sure it works. You may need to test a couple of times, but you should see a new row in the Ads Tracking table with your data.
- Last, go ahead and turn it on so it starts to sync every day!
Depending on how long your campaign has been running, you may also want to import older data into this. Facebook kind of makes this a pain (which is one of the reasons we want to get their data into our own platform), but you can export your ad metrics under Ads Reporting. Just create a report for your campaign, export it as a CSV, import or copy/paste into your Airtable, and match the fields.
Here’s a full guide on how to export from Facebook Ads manager and import into Airtable.
We’re making so much progress! While we’re here, though, let’s configure our conversions.
Step 3: Create the Conversion Tracking Automation
Remember, we’re not only tracking clicks and, eventually, purchases in our funnel. After all, conversions won’t happen for at least a few days as contacts move through the funnel. But to see how effective our funnel is, we also want to see how many people join the funnel and start getting our autoresponder messages.
To do that, you can tap into either your email sign up form or email subscription. Since the funnel we’re working on kicks off when they fill out an assessment, we’ll use that as our conversion event. Here’s the automation in Zapier:
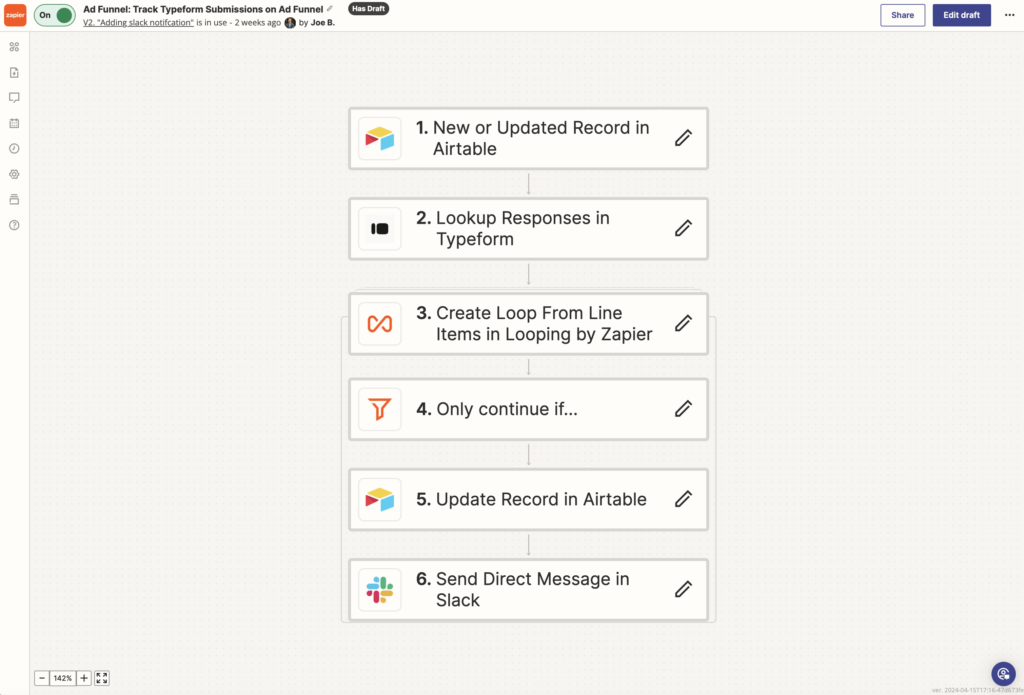
Now this one is a bit complicated. We could simplify the zap by tracking each conversion in a separate table on our database (just like we’ll do with the product sales tracking next), but that would mean we would have four tables instead of just three. And by the way, you might have to do that too, depending on how your email newsletter service integration with Zapier works.
But since we’re using Typeform, we have the option of grabbing all the responses from the previous day all at once instead of getting them as they come in and storing them in Airtable. This way is just a little more efficient and requires less configuration work in Airtable (but again, you may have to track conversion events one after the other and store them in Airtable).
Here’s the detailed, step-by-step version of how this works (or you can check out the template here).
 Trigger: when a new record is created in the Ad Tracking table. This uses the previous step, the daily ad spend tracking automation from Make.com, to trigger whenever a new row is created. For example, when that automat pulls data from Facebook Ads and pops it into a new record in Airtable, it then triggers this automation to begin the process of filling in the blank conversion details.
- Lokup Responses in Typeform: After the trigger, the Zap looks up the corresponding responses in Typeform from the day before (matching the time period from Airtable). Set the start time to “{Date}T00:00,” i.e. midnight, and end time to “{Date}T23:59,” i.e. the end of that day. This should pull all the forms that were submitted during that time period.
- Create Loop From Line Items in Looping by Zapier: This step uses Zapier’s looping feature to count how many line items there are. There’s probably an easier way to do this, but it works great!
- Only continue if… last iteration is true: This is a filter step that only continues if it’s the last item in the loop (e.g. 3 of 3). That way we only do the following steps once!
- Update Record in Airtable. This action will update the record in Airtable with the count from step 3, allowing us to record how many people submitted the form and thus how many conversions we’ve had!
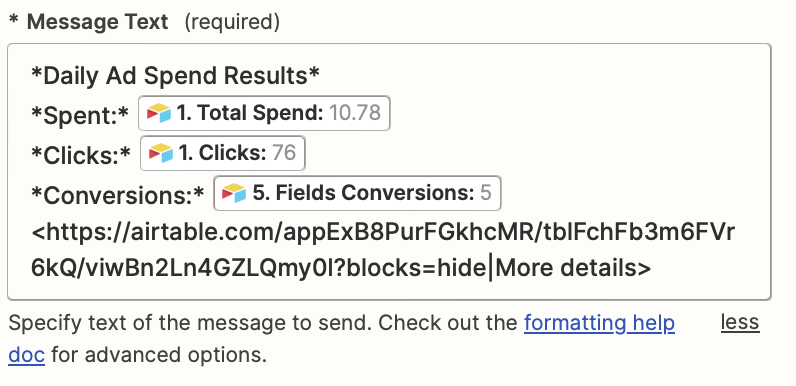
- Send Direct Message in Slack: Finally, once the Airtable record has been updated, a direct message is sent in Slack letting us know what the results were from the day before. It’s always nice to get a notification with detailed reports on your marketing campaigns! Formatting messages in slack can be a bit tricky, but fortunately there’s a good simple guide right below the message box. I always like to have some relevant details and a link to the record so I can get more info if I need.
This should help you and your advertising team increase your budget efficiency and grow your company’s revenue.
Make sure to test everything and turn on the automation, but once you’ve done that, your conversion tracking should be all set!
Step 4: Create the Funnel Product Sales Tracking
Alright, we’re getting really close. But next, we need to bring in our product sales.
This is a relatively straightforward automation that tracks new sales from your shopping cart (which, in our case, is Samcart) and ads them as line items.
We’ll filter only for products that are part of the funnel, and it’s not a bad idea to even create product variants, if you need to, so you only track purchases that are coming from ads.
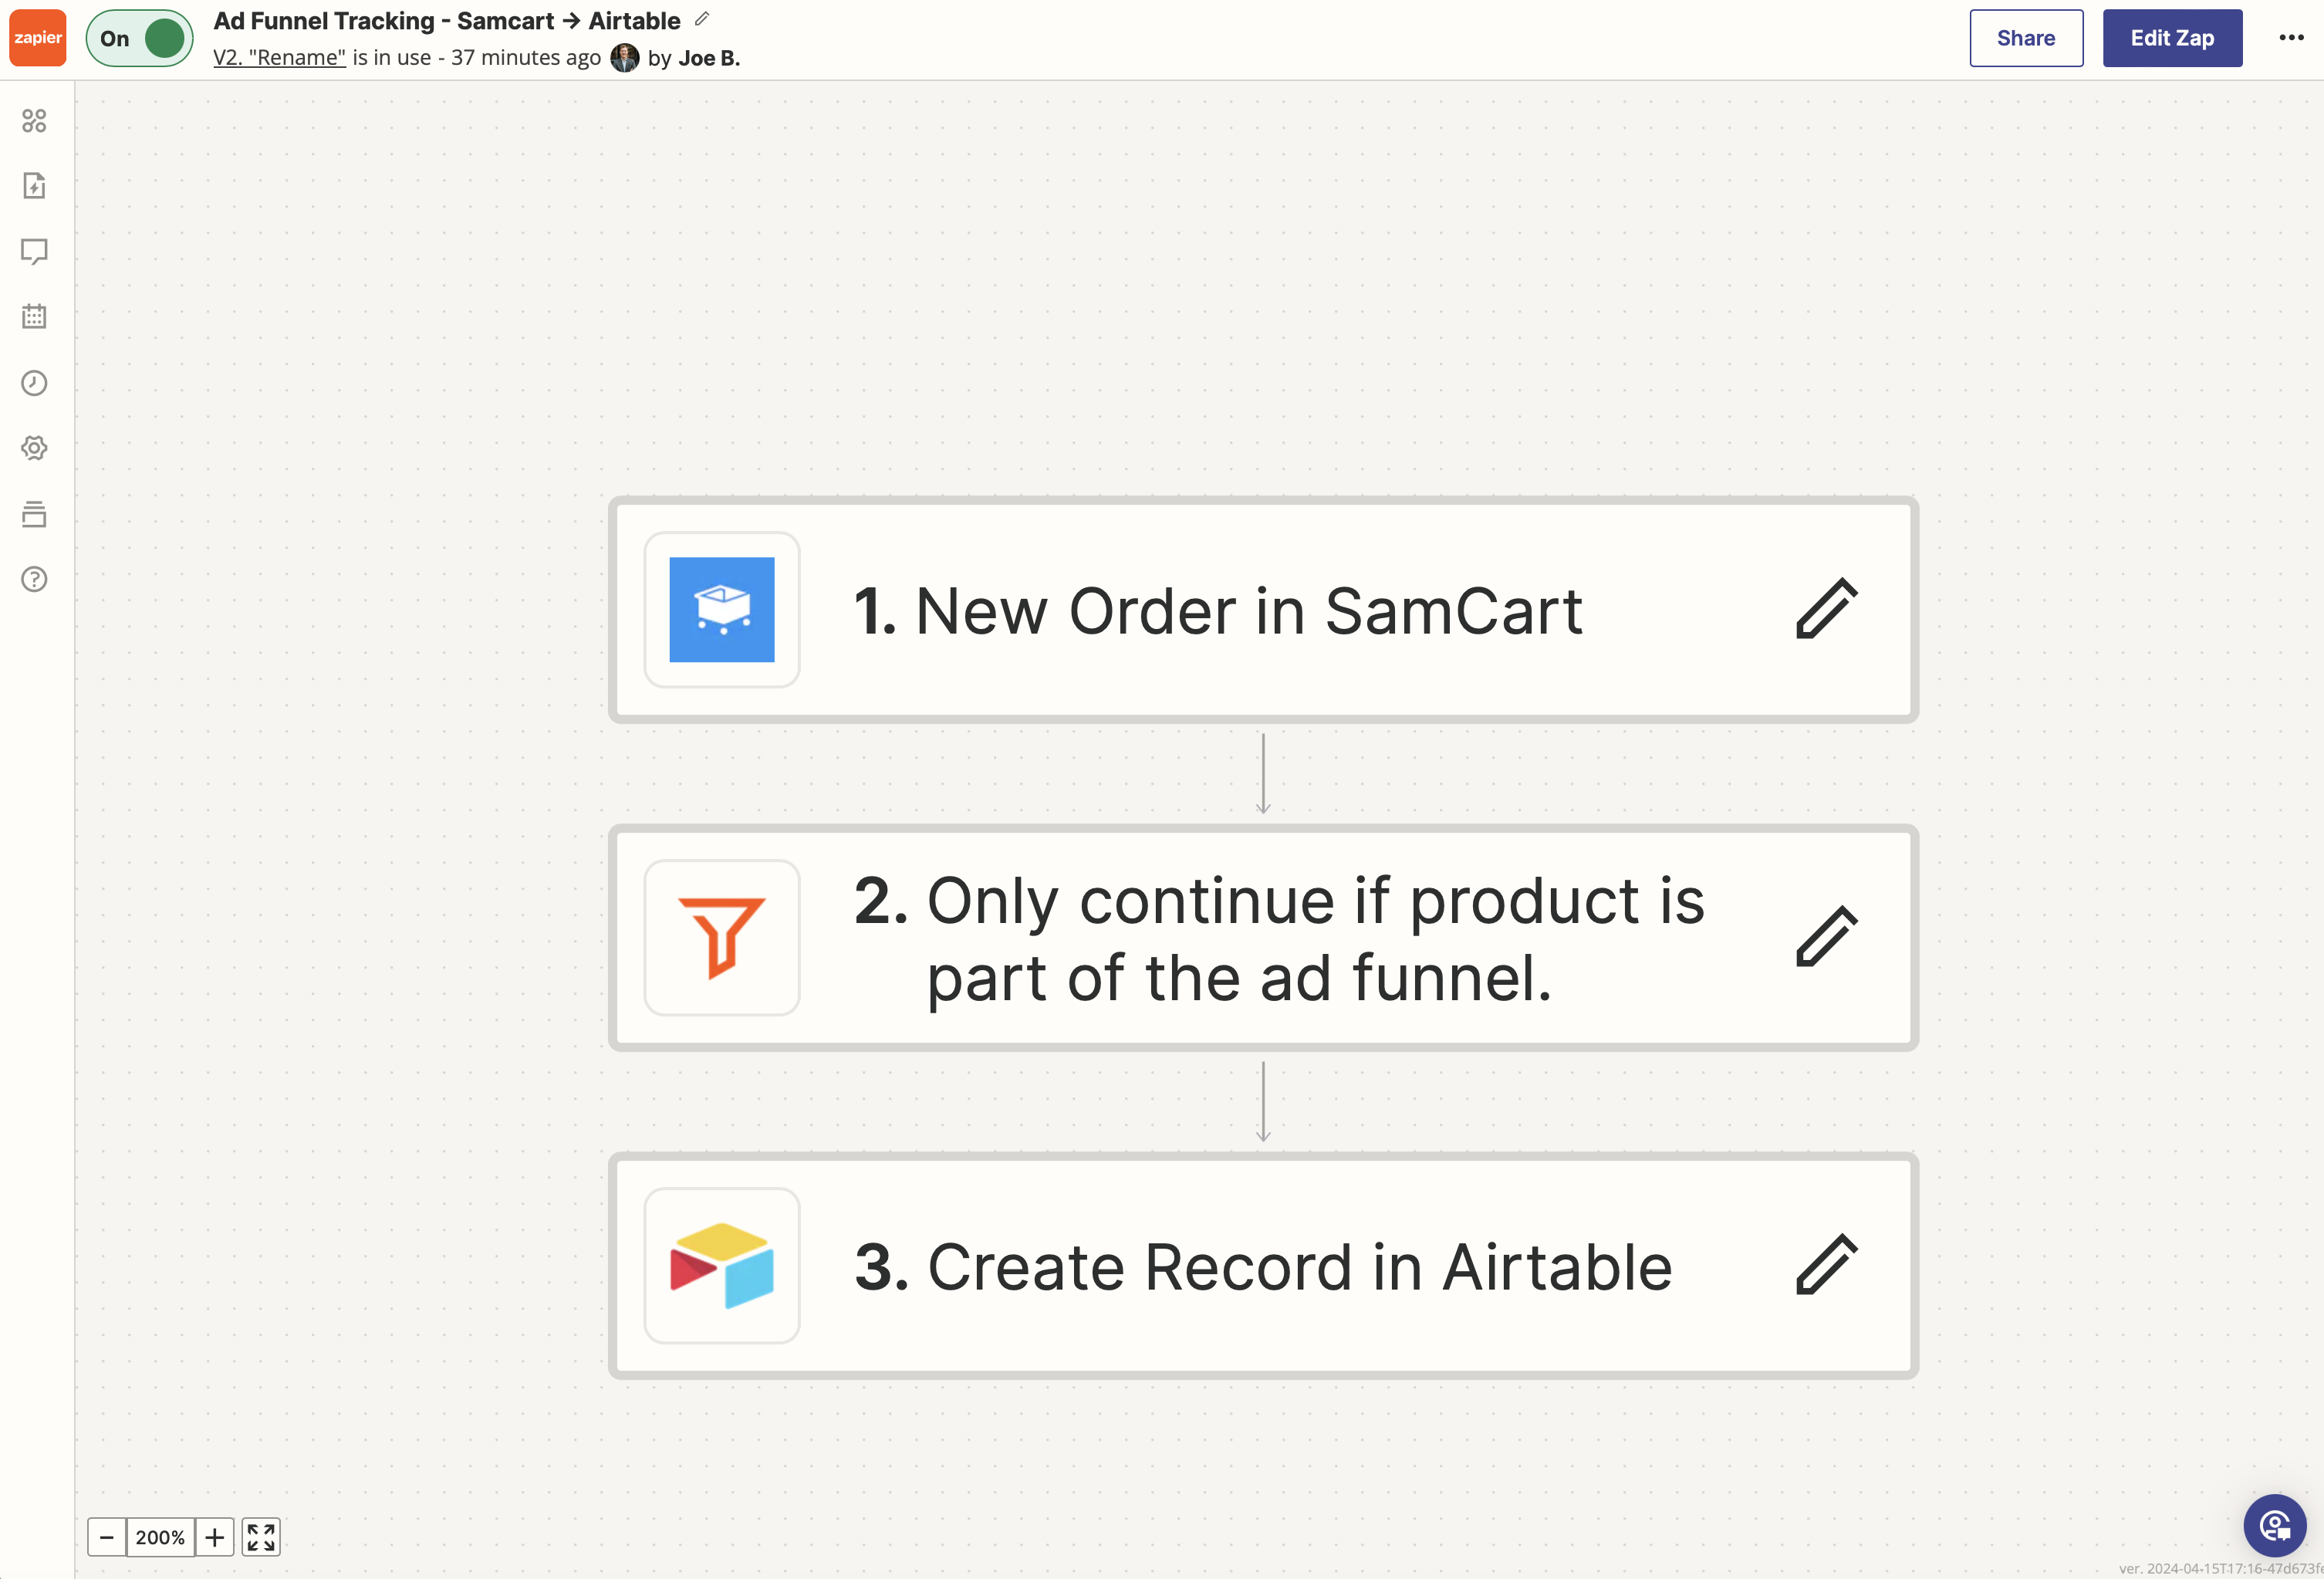
You can check out the template here.
When you’re creating the record in Airtable, make sure to match the parameters to the fields, focusing especially on the total order revenue and date (which will automatically fill in the all important week field). Then, test everything and turn it on!
P.S. You might want to import product sales to track sales from before this automation. Just export the orders of the products that are part of your funnel and then import them into Airtable.
Step 5: Link it All Together in Airtable!
Alright folks, this is the last step! The only thing we have left to do is to link everything together in Airtable so that our Analysis dashboard works!
The easiest way to do that is actually with Airtable’s native automations, which give us a little more control over how the automations trigger. We’re going to use three quick and easy automations.
You can check these out in our Ad Funnel Tracking Airtable template or follow the steps below to create them yourself.
Airtable Automation 1: Create Week Record in the Analysis Table
To get started, click the “Automations” tab in the top navigation menu.

First, we’ll set up a weekly automation to create a new “Week” in the analysis table. This will pull all the different records from that week into one spot so we can compare everything.
- Trigger: At a scheduled time weekly. I set this to start on Monday at 12:00am on Monday because you do want it to begin before any other automation can fire for that week.
- Create record: Once triggered, the automation creates a new record for that week in the “Weekly Ad Spend Analysis” table. This will exactly match the format in the other “Week” fields, eg. “Week 15 (2024).”
You can stop there and things will work great, but I also like to send a Slack notification with the previous week’s results. To do that, though, you need to do a couple of steps that I’ll describe a little further below.
Airtable Automation 2: Link Ad Records
Next, we’re going to link all the Ad records to the Analysis table (so we don’t have to do this manually, which would defeat the whole purpose of this automation right?!).
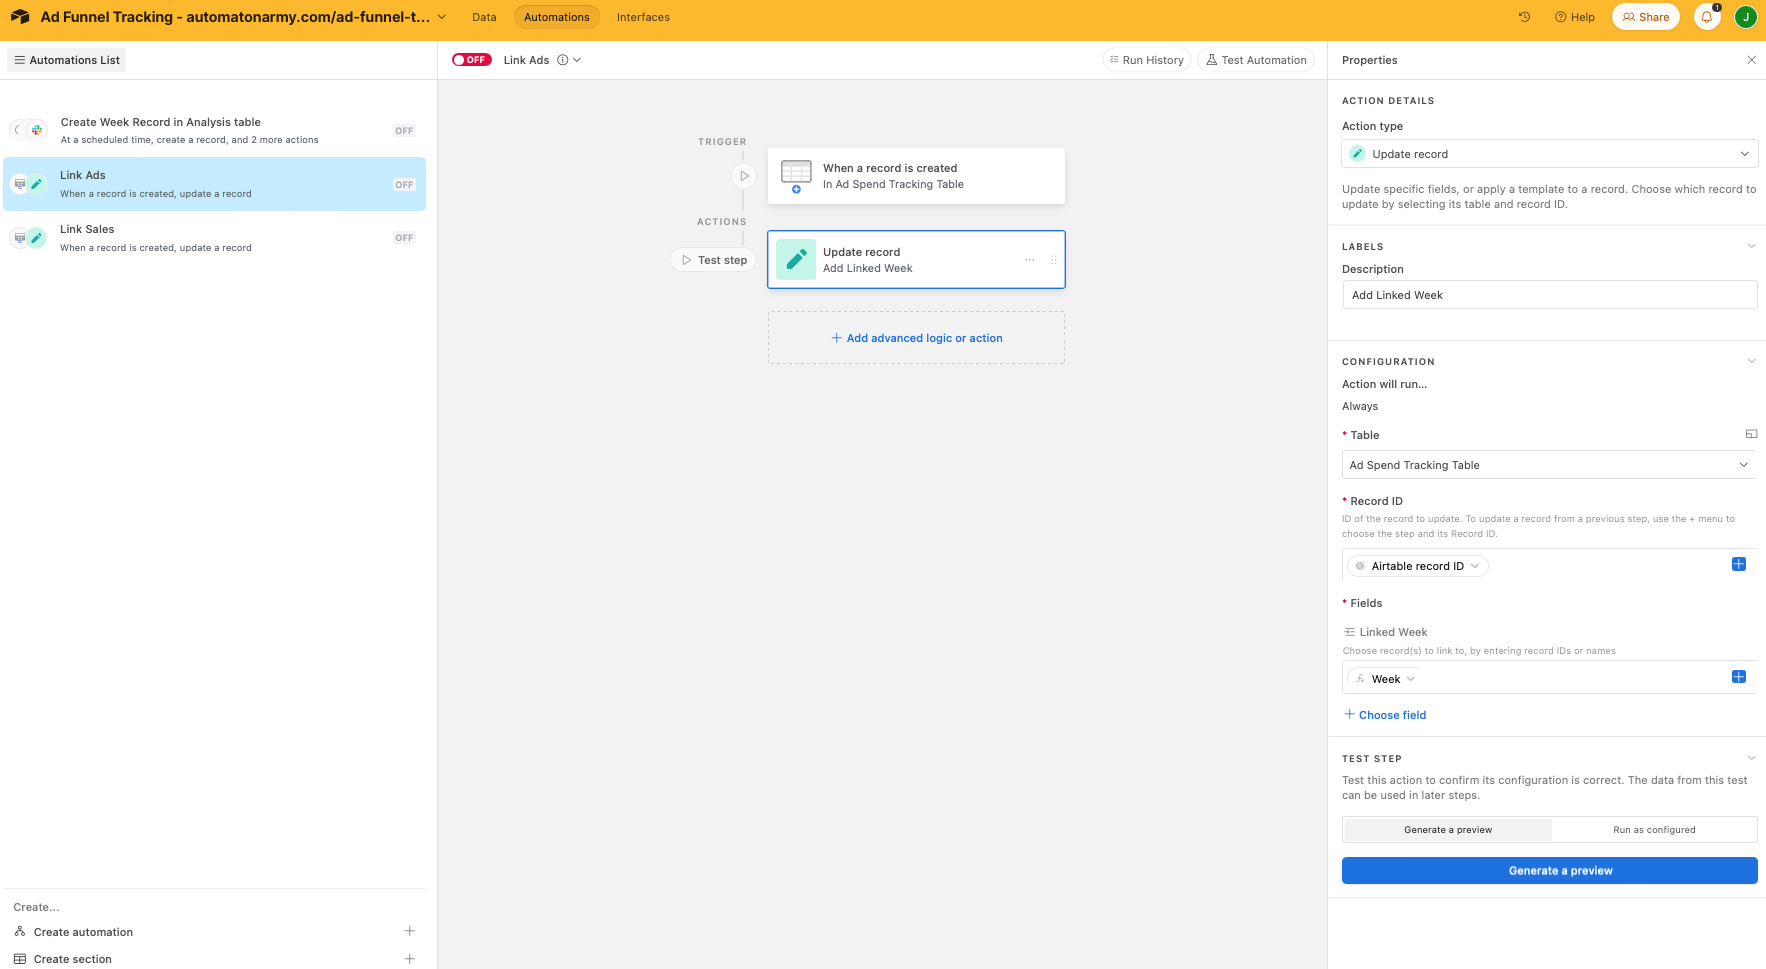
This is an easy one:
- Trigger whenever a new record is created in the Ad Spend Tracking table.
- Then, update the record by modifying the “Linked Week” field with the same value as the “Week” field.
This will automatically link any new record from the Ads Tracking table to the analysis table. So cool, right?!
(Note: Any older or imported records will have to be linked manually, but it should be pretty easy. Just copy/paste the “Week” field into the “Linked Week” field and you’ll be set.)
Make sure to turn on the automation! Next, we’re going to do the same thing for the Sales table.
Airtable Automation 3: Link Product Sales Records
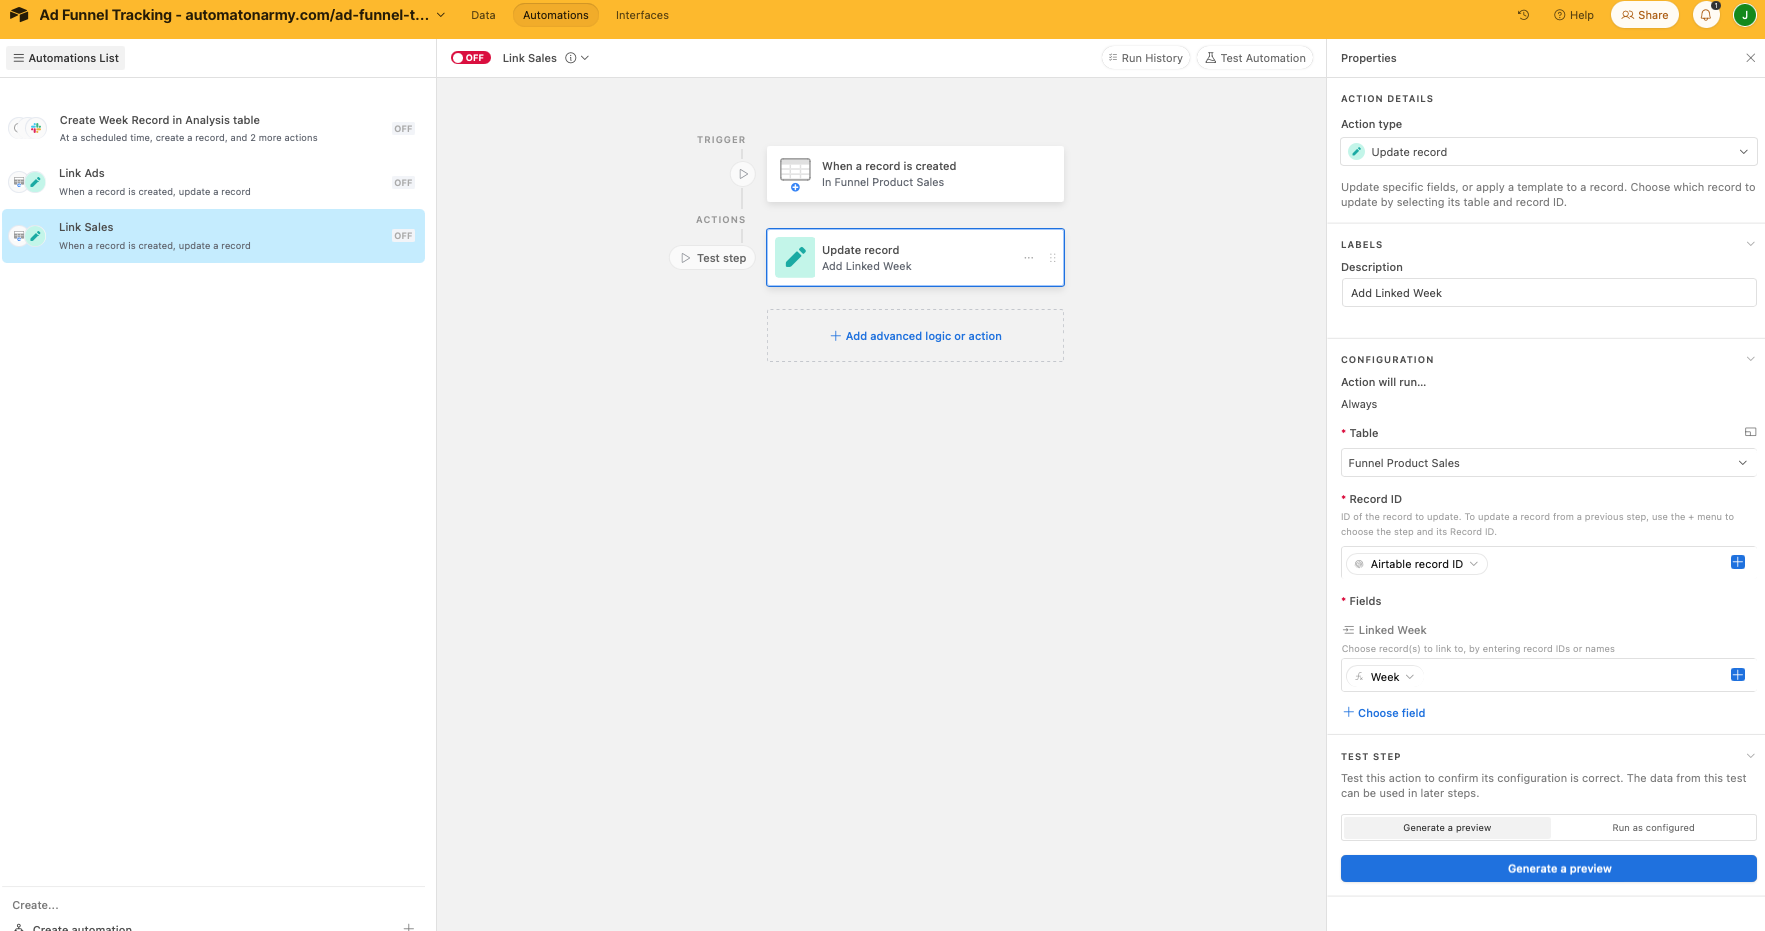
Finally, we’re going to link up all of our product sales.
- Trigger whenever a new record is created in the Product Sales table.
- Then, update the record by modifying the “Linked Week” field with the same value as the “Week” field.
This will automatically link any new record from the Product Sales table to the Analysis table!
As always, make sure you test and turn on your automation.
Step 6 (Optional): Configure a Weekly Ad Spend Notification
The automation is done, but we have one last optional step to get a notification with weekly ad results (along with the spending recommendation).
To do this, we need to create a custom view to make sure Airtable pulls the right data, because we don’t want THIS week’s ad results. We want LAST week’s ad results. Fortunately, with a little filter, we’ll make sure to narrow down the right results.
Here’s how to create the view:
- Create a copy of the default view and title it “Previous Full Week” so you can find it easily.
- Set the filter to the following conditions:Where “Week Starting”… is after… number of days ago… 13
AND “Week Starting”… is before… number of days ago… 6

This will display ONLY the previous week’s record. If you want fewer notifications, you could set this to a monthly result just by changing the number of days.
Next, we need to add two steps to our “Airtable Automation 1: Create Week Record in the Analysis Table”:
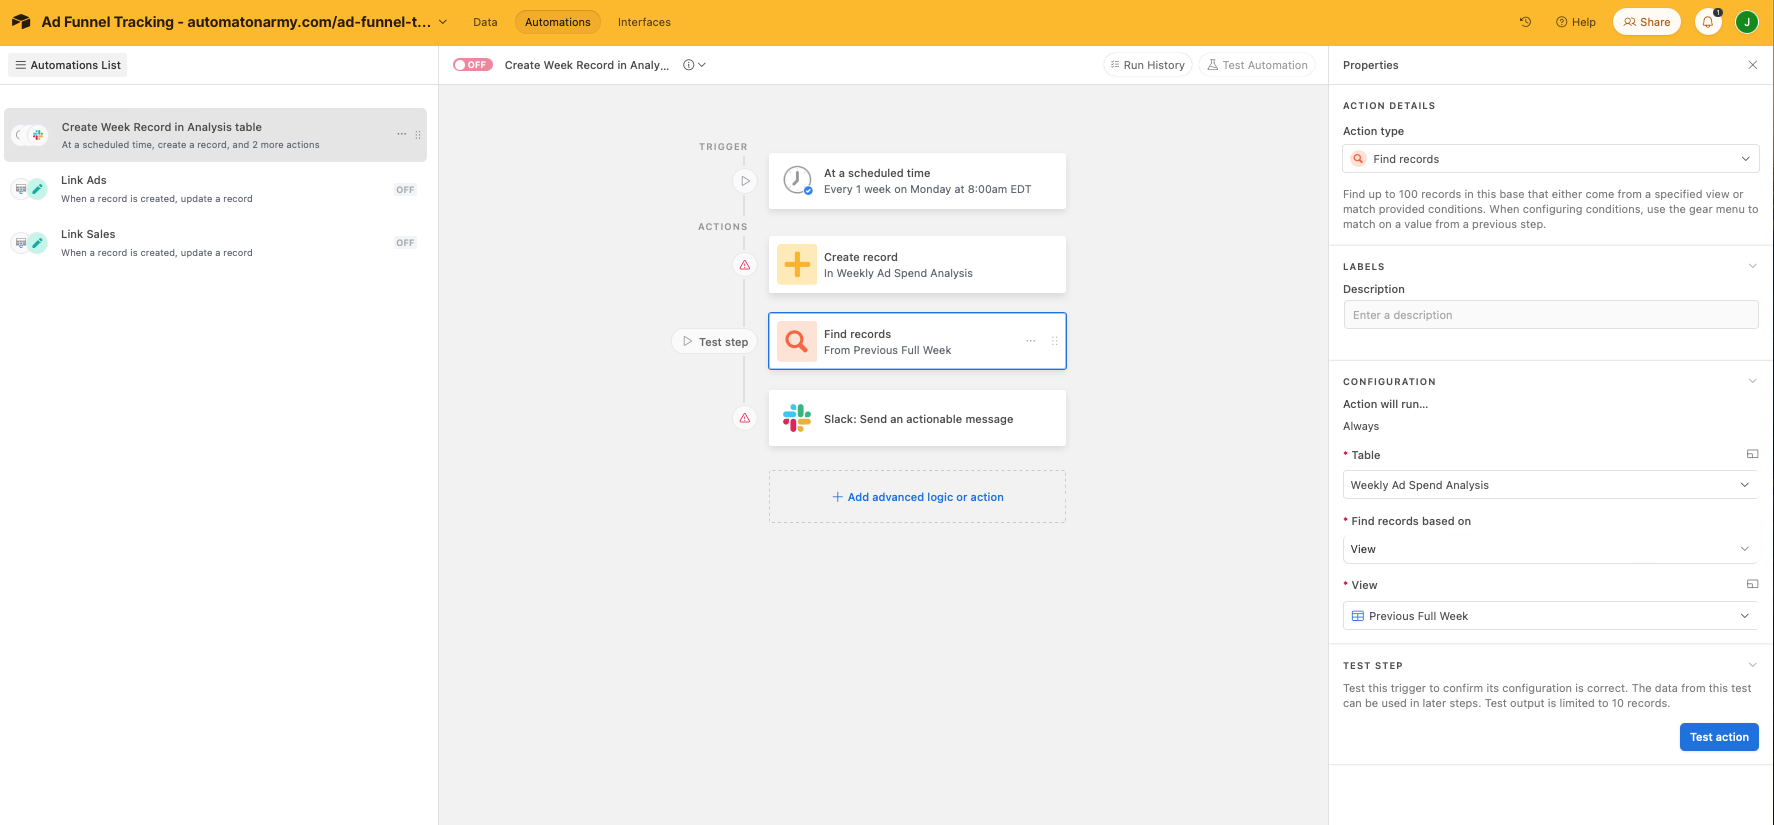
- Find records from the “Previous Full Week” view we just created. It doesn’t matter WHAT record we find, since there will only be one!
- Send an Actionable Slack message. Your message can have whatever you want, but I like to include the total spend, total revenue, surplus/defecit, and recommendation, plus a link to my Facebook Ads manager and a link to the record.
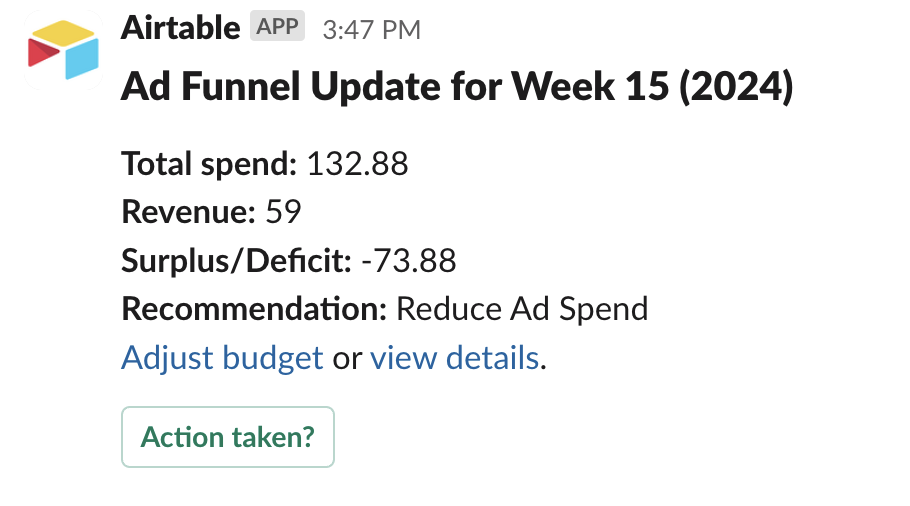
With an Actionable Slack message, you can also add a button to the bottom that will trigger a change in the Airtable. I set this to mark the “Action Taken” checkbox as “True” if the button is pressed and add the date it’s pressed, so that if I change the advertising budget I can track that.

And just like that, your complete ad spend tracking automation is complete. You can now enjoy your daily and weekly notifications with how your ad spend is doing!
Now, Go Monitor Your Ad Spend
Online Advertising can be a great way to find new customers or clients if you carefully manage your spending and create funnels that work. To do that, you need data, and this automation helps you get all the data you need to make the right decision about your ad spend.
Give it a try and let me know how if you recruit this automaton into your army in the comments!
Do you currently track your ad spend, conversions, and sales funnel? Would this automation help you use your ad budget efficiently and build successful campaigns? Let me know in the comments!

